Maryland Crash Data
Maryland takes a data-driven approach to reach our goal of zero roadway fatalities and serious injuries.

Questions or media inquiries about the below data can be submitted to MDOT MVA’s Highway Safety Office’s Communications and Media Manager Rachel Andress.
CRASHES ARE NO ACCIDENT
Maryland takes a data-driven approach to reach our goal of zero roadway fatalities and serious injuries.
-
89
REPORTED FATALITIES THIS YEAR TO DATE 2026
Data Last Updated: 4/13/2026 4:59:21 AM -
107
REPORTED FATALITIES LAST YEAR TO DATE 2025
Data Last Updated: 4/13/2026 4:59:21 AM
Crash Summaries
The breakdown below shows the major causes of motor vehicle crashes and resulting fatalities in Maryland.
Statewide Crash Summary
| 2019 | 2020 | 2021 | 2022 | 2023 | 5-Year Average | |
| Fatal Crashes | 496 | 546 | 524 | 534 | 577 | 535 |
| Injury Crashes | 32,938 | 25,360 | 28,142 | 28,027 | 28,577 | 28,609 |
| Property Damage Crashes | 82,583 | 69,728 | 80,243 | 79,908 | 81,247 | 78,742 |
| Total Crashes | 116,017 | 95,634 | 108,909 | 108,469 | 110,401 | 107,886 |
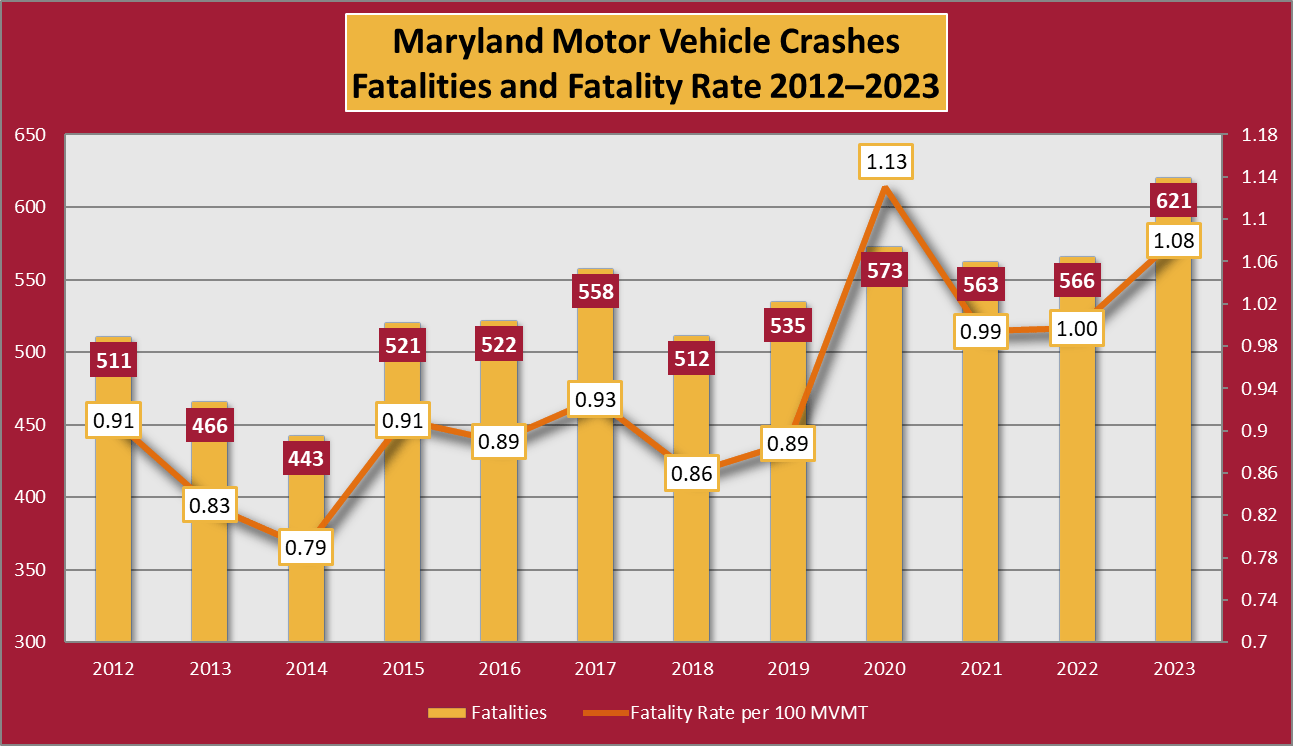
| Total of All Fatalities | 535 | 573 | 563 | 566 | 621 | 572 |
| Total Number Injured | 48,682 | 36,790 | 40,858 | 40,719 | 41,538 | 41,717 |
Rates
Driver Alcohol or Drugs Involved
2019 – 2023 Crash Summary
| 2019 | 2020 | 2021 | 2022 | 2023 | 5-Year Average | |
| Fatal Crashes | 131 | 173 | 155 | 135 | 116 | 142 |
| Injury Crashes | 2,106 | 1,831 | 1,906 | 1,704 | 1,668 | 1,843 |
| Property Damage Crashes | 4,628 | 4,217 | 4,480 | 3,941 | 3,671 | 4,187 |
| Total Crashes | 6,865 | 6,221 | 6,541 | 5,780 | 5,455 | 6,172 |
| Total of All Fatalities | 151 | 186 | 174 | 146 | 132 | 158 |
| Total Number Injured | 3,227 | 2,696 | 2,810 | 2,534 | 2,447 | 2,743 |
Speed / Aggressive Driver Involved
2019 – 2023 Crash Summaries
Aggressive Driver Involved
| 2019 | 2020 | 2021 | 2022 | 2023 | 5-Year Average | |
| Fatal Crashes | 37 | 55 | 32 | 33 | 55 | 42 |
| Injury Crashes | 1,387 | 1,027 | 1,109 | 1,106 | 1,130 | 1,152 |
| Property Damage Crashes | 2,654 | 1,885 | 2,135 | 2,226 | 2,287 | 2,237 |
| Total Crashes | 4,078 | 2,967 | 3,276 | 3,365 | 3,472 | 3,432 |
| Total of All Fatalities | 39 | 61 | 33 | 36 | 62 | 46 |
| Total Number Injured | 2,200 | 1,677 | 1,762 | 1,784 | 1,867 | 1,858 |
Crash Summary Report – Aggressive (2023)
Speed Involved
| 2019 | 2020 | 2021 | 2022 | 2023 | 5-Year Average | |
| Fatal Crashes | 72 | 101 | 88 | 99 | 95 | 91 |
| Injury Crashes | 2,738 | 2,115 | 2,228 | 2,185 | 2,224 | 2,298 |
| Property Damage Crashes | 6,375 | 5,356 | 5,638 | 5,643 | 5,386 | 5,680 |
| Total Crashes | 9,185 | 7,572 | 7,954 | 7,927 | 7,705 | 8,069 |
| Total of All Fatalities | 76 | 110 | 97 | 110 | 102 | 99 |
| Total Number Injured | 4,041 | 3,031 | 3,190 | 3,220 | 3,225 | 3,341 |
Crash Summary Report – Speed (2023)
Distracted Driver Involved
2019 – 2023 Crash Summary
| 2019 | 2020 | 2021 | 2022 | 2023 | 5 Year Average | |
| Fatal Crashes | 183 | 205 | 205 | 189 | 203 | 197 |
| Injury Crashes | 17,668 | 13,227 | 14,468 | 14,472 | 14,332 | 14,833 |
| Property Damage Crashes | 38,883 | 31,993 | 36,301 | 36,401 | 35,768 | 35,869 |
| Total Crashes | 56,734 | 45,425 | 50,974 | 51,062 | 50,303 | 50,900 |
| Total of All Fatalities | 196 | 216 | 222 | 200 | 216 | 210 |
| Total Number Injured | 26,399 | 19,253 | 21,165 | 21,226 | 20,951 | 21,799 |
Motorcycle Involved
2019 – 2023 Crash Summary
| 2019 | 2020 | 2021 | 2022 | 2023 | 5-Year average | |
| Fatal Crashes | 74 | 81 | 77 | 75 | 80 | 77 |
| Injury Crashes | 897 | 907 | 964 | 966 | 947 | 936 |
| Property Damage Crashes | 282 | 301 | 305 | 297 | 323 | 302 |
| Total Crashes | 1,253 | 1,289 | 1,346 | 1,338 | 1,350 | 1,315 |
| Total of All Fatalities | 77 | 81 | 78 | 77 | 82 | 79 |
| Total Number Injured | 1,058 | 1,092 | 1,117 | 1,113 | 1,095 | 1,095 |
Crash Summary Report – Motorcycle (2023)
Motorcycle Crashes and Helmet Use (2021)
Pedestrian on Foot Involved
2019 – 2023 Crash Summary
| 2019 | 2020 | 2021 | 2022 | 2023 | 5-Year Average | |
| Fatal Crashes | 124 | 130 | 125 | 131 | 153 | 133 |
| Injury Crashes | 2,752 | 2,001 | 2,194 | 2,272 | 2,503 | 2,344 |
| Property Damage Crashes | 264 | 217 | 240 | 210 | 236 | 233 |
| Total Crashes | 3,140 | 2,348 | 2,559 | 2,613 | 2,892 | 2,710 |
| Total of All Fatalities | 124 | 131 | 127 | 132 | 159 | 135 |
| Total Number Injured | 3,111 | 2,342 | 2,524 | 2,596 | 2,837 | 2,682 |
Bicycle or Other Pedalcycle Involved
2019 – 2023 Crash Summary
| 2019 | 2020 | 2021 | 2022 | 2023 | 5-Year Average | |
| Fatal Crashes | 10 | 16 | 6 | 11 | 15 | 12 |
| Injury Crashes | 686 | 580 | 583 | 606 | 656 | 622 |
| Property Damage Crashes | 154 | 122 | 147 | 131 | 167 | 144 |
| Total Crashes | 850 | 718 | 736 | 748 | 838 | 778 |
| Total of All Fatalities | 10 | 16 | 6 | 11 | 15 | 12 |
| Total Number Injured | 728 | 616 | 613 | 650 | 701 | 662 |
Crash Summary Report- Bicycle or Other Pedalcycle (2023)
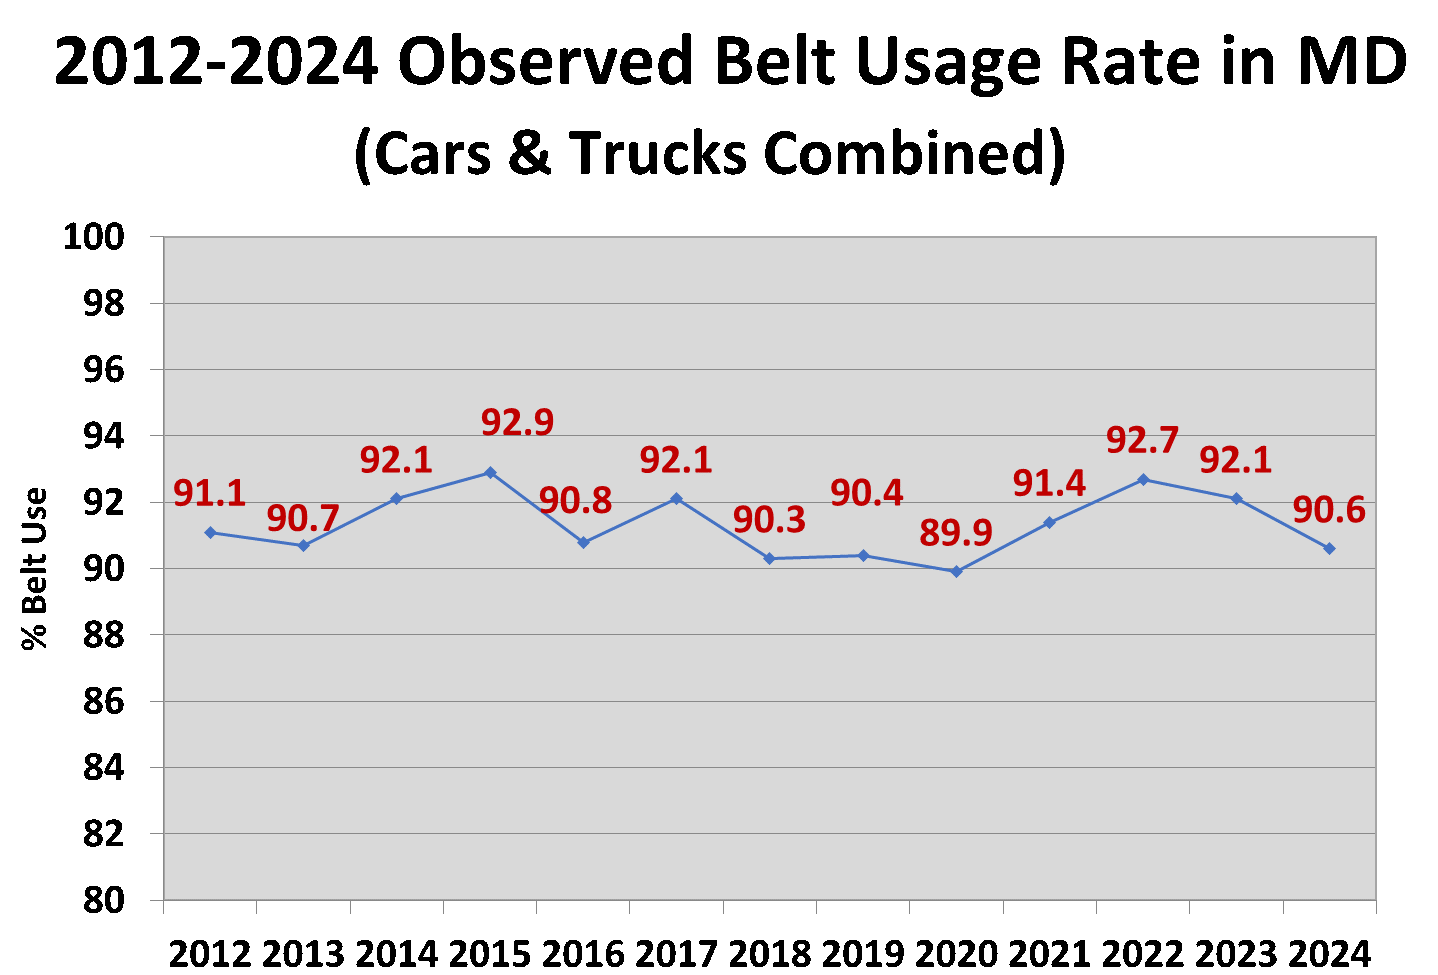
Occupant Protection Data Resources
Crashes and Fatalities by Jurisdiction
Crash Data Summary: Crash Data Summary Reports are based on data from the statewide police crash report database (ACRS), processed by the MDOT-State Highway Administration, and provide detailed aggregate information on motor vehicle crashes (overall, injury, and fatal) as well as jurisdiction-level occurrences.
Crash/Crime Clocks: The Crime/Crash Clocks represent the annual ratio of crime and motor vehicle crashes to fixed time intervals (sources: Maryland State Police Uniform Crime Report and crash data from the MDOT-State Highway Administration which maintains a database derived from crash reports maintained by the Maryland State Police).
Safety Equipment Use Summaries: Safety Equipment Use Summaries are based on crash investigation data from the Maryland State Police Automated Crash Reporting System (ACRS), and are aggregated from a query on the Safety Equipment Used field for Drivers and Occupants, excluding any non-motorists, motorcyclists, mopeds, or ATVs. For the years 2015 and later, unrestrained occupants are summarized by a query of “None” for Safety Equipment Used. Prior to 2015, “Air Bag Only” was included in the query.